Primary data
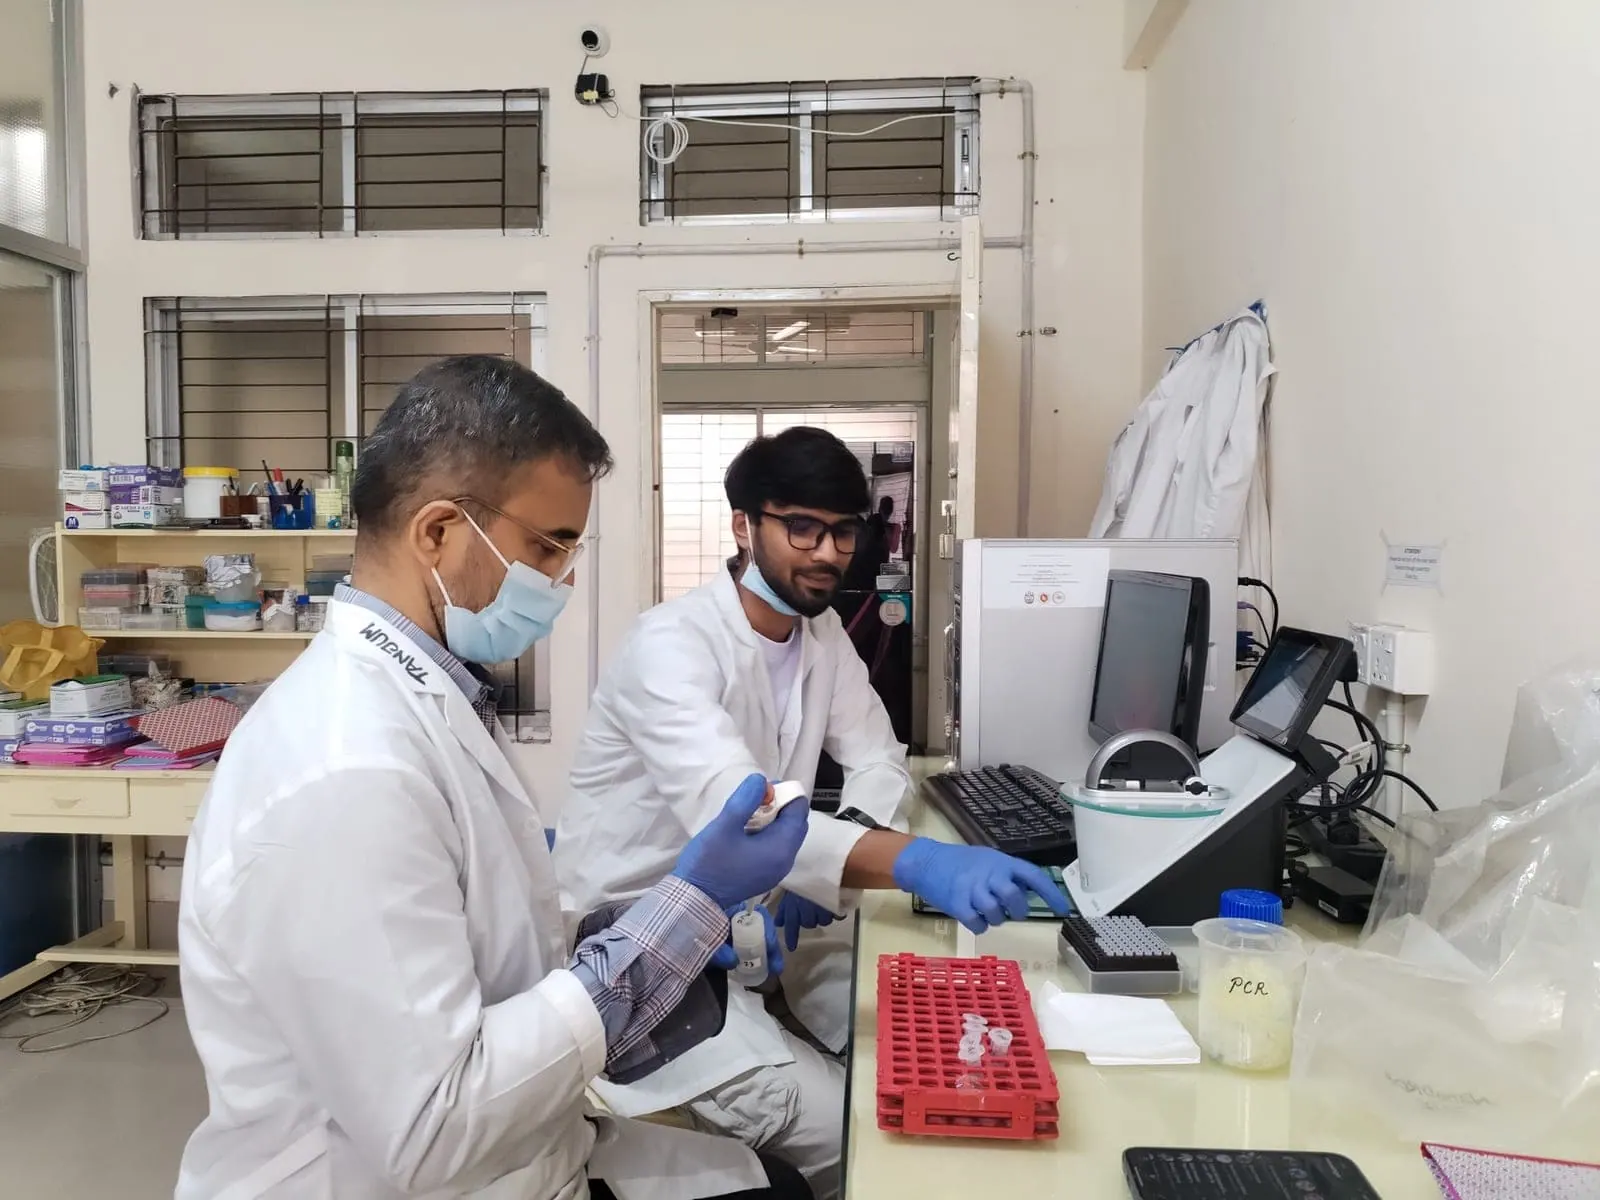
Generated at the benchThree figures from the M.Sc. thesis cohort. The electropherogram and quality profile are rendered straight from the raw .ab1 records, so every point shown is measured data.
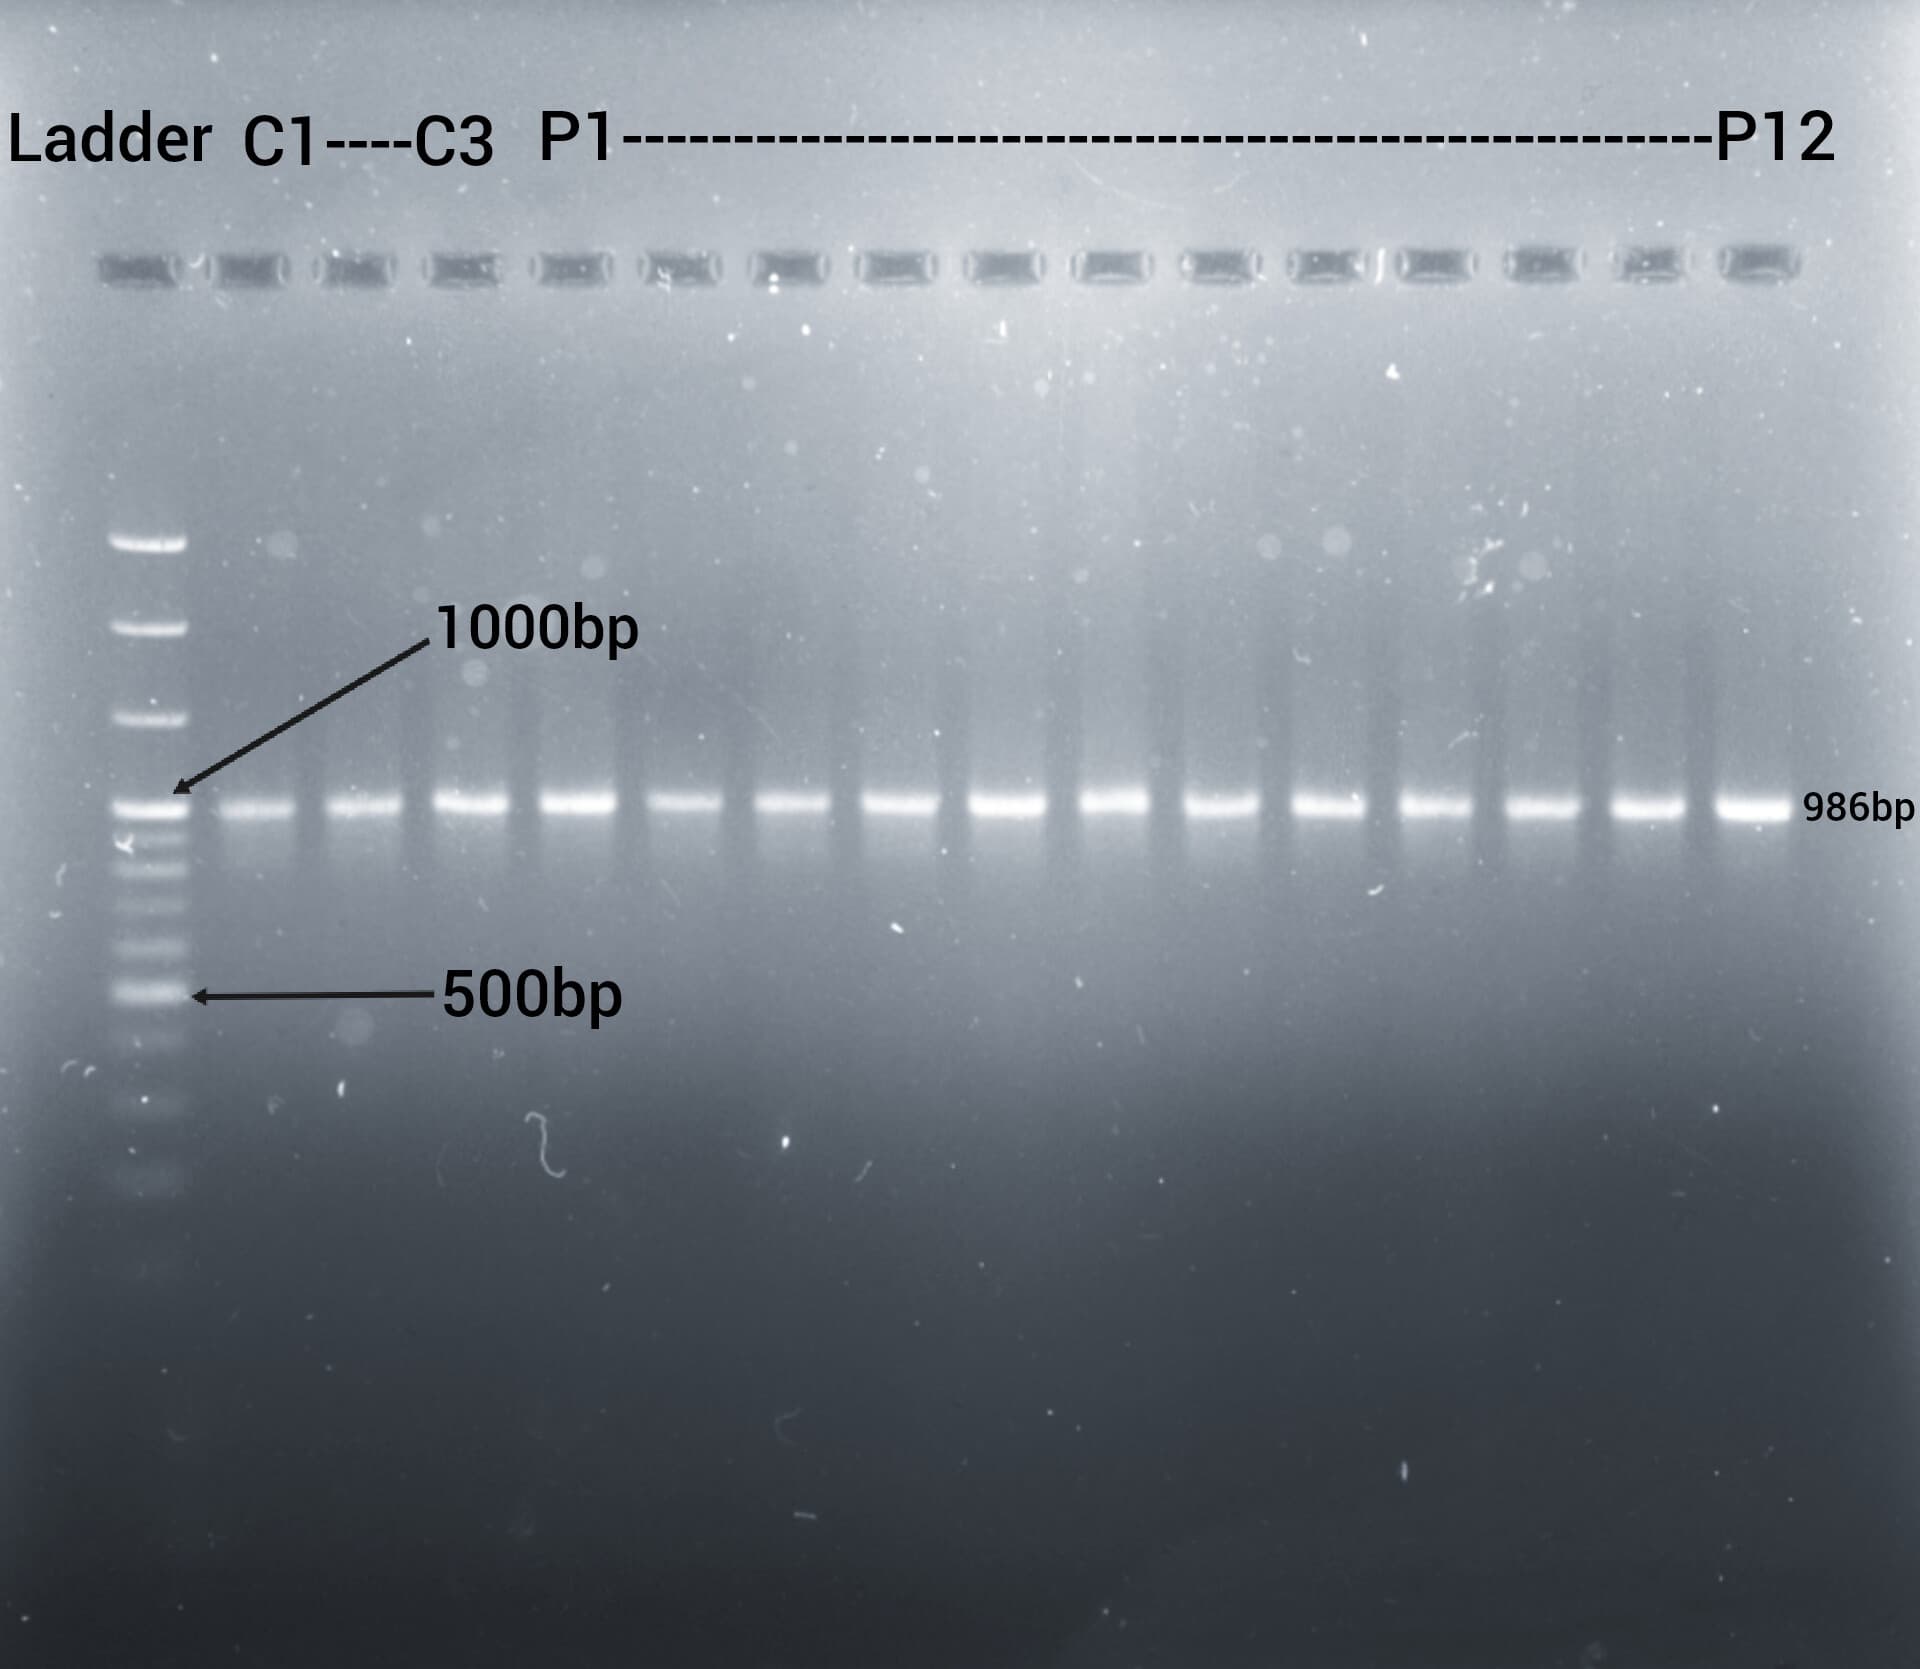
PCR amplification of the MMP3 target region
Amplicon
986 bp
Lanes
3 controls + 12 patients
Specificity
Single band, all lanes
A single, clean 986 bp product in every lane, with no primer dimer and no secondary bands. Controls (C1–C3) and patients (P1–P12) amplify at equal intensity, confirming the reaction was specific and consistent across the plate before any sample went forward to sequencing.
Method. Genomic DNA extracted from whole blood; MMP3 target amplified by PCR and resolved on agarose gel against a 100 bp ladder.
Sanger electropherogram with a heterozygous call
Call
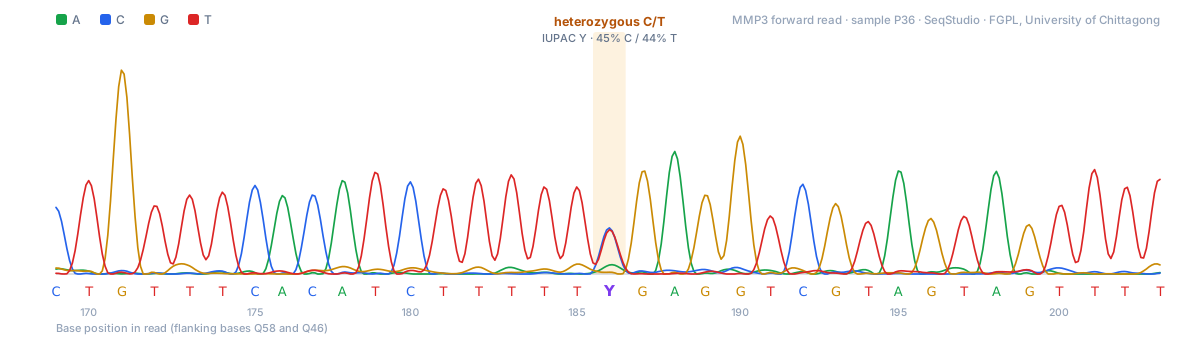
Heterozygous C/T
Peak ratio
45% C / 44% T
Flanking quality
Q58 and Q46
Thirty-five bases from the MMP3 forward read of sample P36. The highlighted position carries two overlapping peaks of near-equal height - 45% C against 44% T - which the base caller reports as IUPAC Y. Flanking bases call at Q58 and Q46, so the ambiguity is genuine heterozygosity rather than poor signal. The same position resolves as a heterozygote in all five high-quality reads on the plate.
Method. Rendered directly from the raw .ab1 trace: four dye channels, peak locations, and per-base quality read from the ABIF record.
Per-base quality across 18 Sanger reads
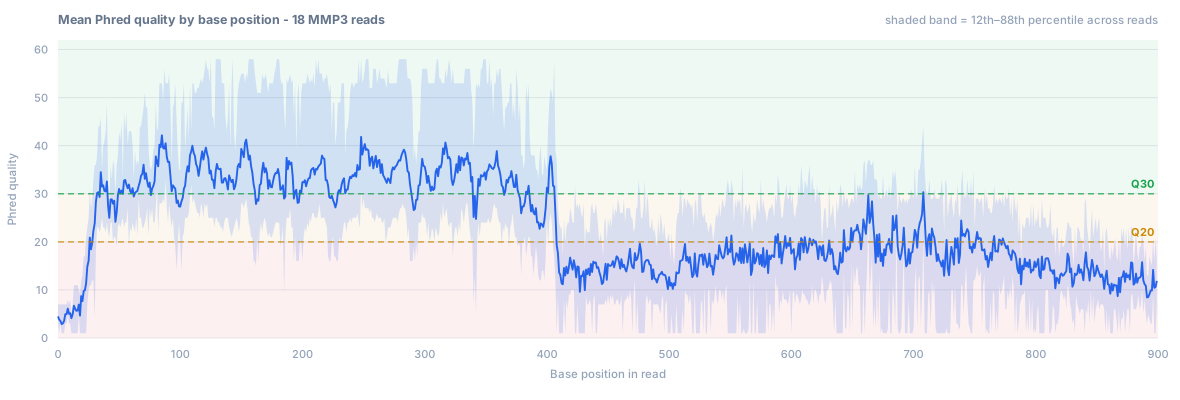
Reads
18 · mean 965 bp
Q30 plateau
Base 32 – 708
Bases ≥ Q20
56.4% of read
Mean Phred quality by base position across all 18 MMP3 reads, with the 12th–88th percentile band showing spread between samples. The profile is the expected Sanger shape: an unusable leader, a high-confidence plateau above Q30 from base 32 to base 708, then decay. Variant calls were taken only from the plateau, and every candidate was confirmed on the reverse read.
Method. Phred scores read from the PCON record of each .ab1 file; no smoothing applied.
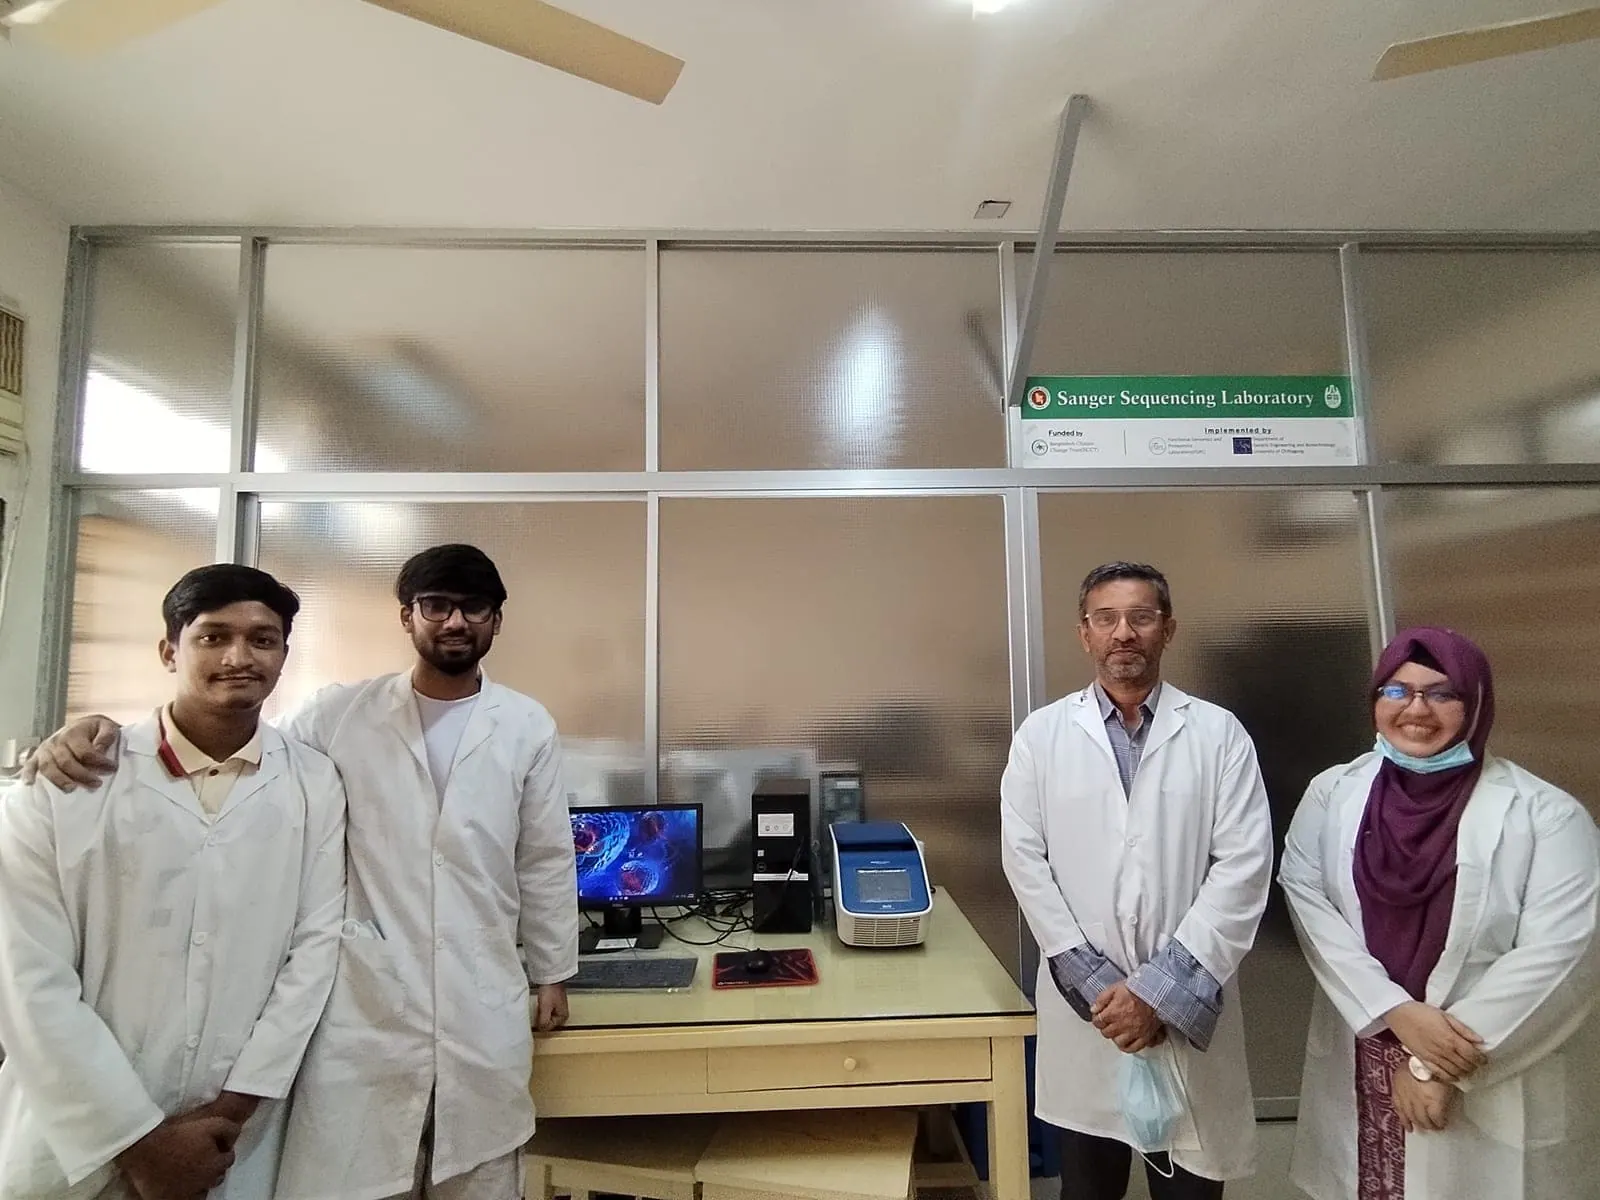
Primary data from the M.Sc. thesis cohort, generated at the Functional Genomics & Proteomics Laboratory, University of Chittagong. Patient and control samples carry study codes only.